
Using ModelBuilder to Automate Repetitive Analyses
Background
ModelBuilder is a visual programming language for building geoprocessing workflows. Geoprocessing models automate and document spatial analysis and data management processes.
Using ModelBuilder allows a user to:
-
Build a model by adding geoprocessing tools, map layers, datasets, and other data types, and connecting them to a process.
-
Visualize a workflow sequence as an easy-to-understand diagram
-
Turn a model into a geoprocessing tool that can be shared with others or can be used in Python scripting and other models
Using ModelBuilder, I created a model to automate the identification of 'flood zones' which area within a certain user-defined distance of a known floodplain. The model workflow can be viewed below.

Purpose
The purpose of building any model is to cut down on the time it takes to repeat a given analysis. This model in particular is meant to identify land parcels that are in danger from severe flooding.
A model’s usefulness is in its ability to streamline tasks, which, in addition to saving time, drastically reduces human error.
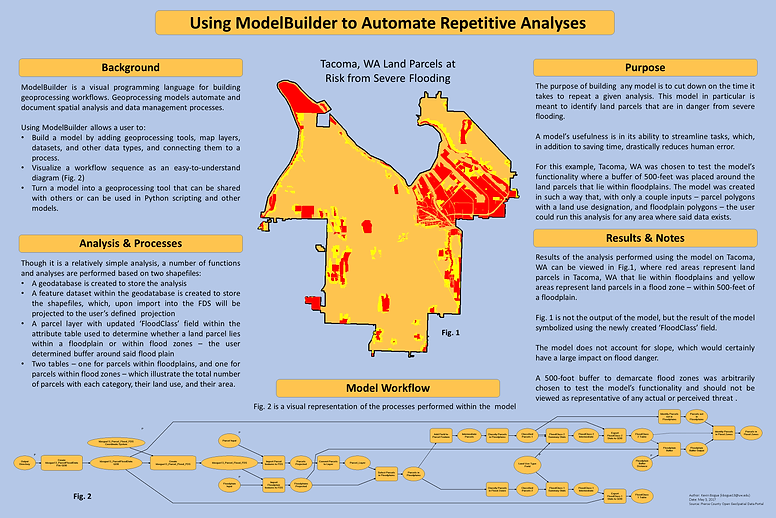
For this example, Tacoma, WA was chosen to test the model’s functionality where a buffer of 500-feet was placed around the land parcels that lie within floodplains. The model was created in such a way that, with only a couple inputs – parcel polygons with a land use designation, and floodplain polygons – the user could run this analysis for any area where said data exists.
Analysis & Processes
Though it is a relatively simple analysis, a number of functions and analyses are performed based on two shapefiles:
-
A geodatabase is created to store the analysis
-
A feature dataset within the geodatabase is created to store the shapefiles, which, upon import into the FDS will be projected to the user’s defined projection
-
A parcel layer with updated ‘FloodClass’ field within the attribute table used to determine whether a land parcel lies within a floodplain or within flood zones – the user determined buffer around said flood plain
-
Two tables – one for parcels within floodplains, and one for parcels within flood zones – which illustrate the total number of parcels with each category, their land use, and their area.
Results & Notes
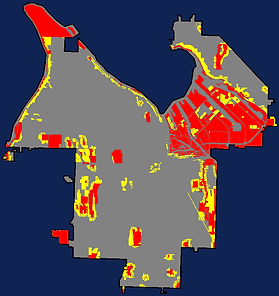
Results of the analysis performed using the model on Tacoma, WA can be viewed to the left, where red areas represent land parcels in Tacoma, WA that lie within floodplains and yellow areas represent land parcels in a flood zone – within 500-feet of a floodplain.
The image on the left is not the output of the model, but the result of the output symbolized using the newly created ‘FloodClass’ field.
The model does not account for slope, which would certainly have a large impact on flood danger.
A 500-foot buffer to demarcate flood zones was arbitrarily chosen to test the model’s functionality and should not be viewed as representative of any actual or perceived threat .